
Read the usage dashboard
See how residents use your city's site, app, alerts and AI assistant, and how that changes over time.
The tabs
Executive overview
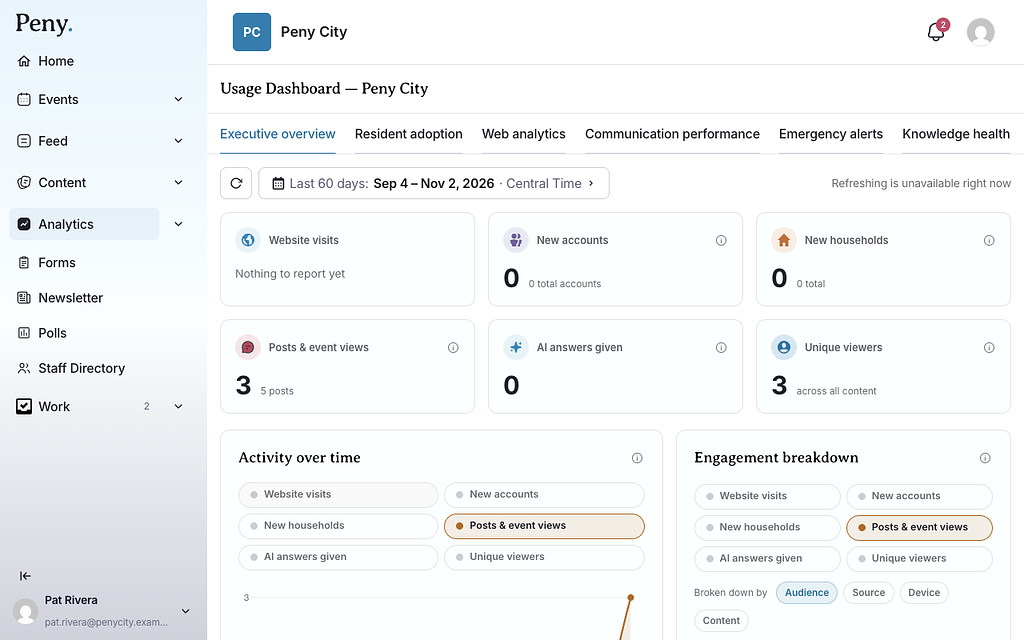
A summary of everything, with six cards: Website visits, New accounts, New households, Posts & event views, AI answers given and Unique viewers.
- Activity over time charts these figures over your date range. Use the buttons above the chart to choose which figures it shows, and click a day to see it hour by hour.
- Engagement breakdown splits the figure you choose by Audience, Source, Device or Content, using the Broken down by buttons.
Resident adoption
How many residents have signed up and are active: Registered residents, Registered households, Current app users, Weekly active residents and Monthly active residents. These are as of today, not the date range you chose. The tab also has a map of Registered residents by address and an Adoption over time chart with its own date picker.
Web analytics
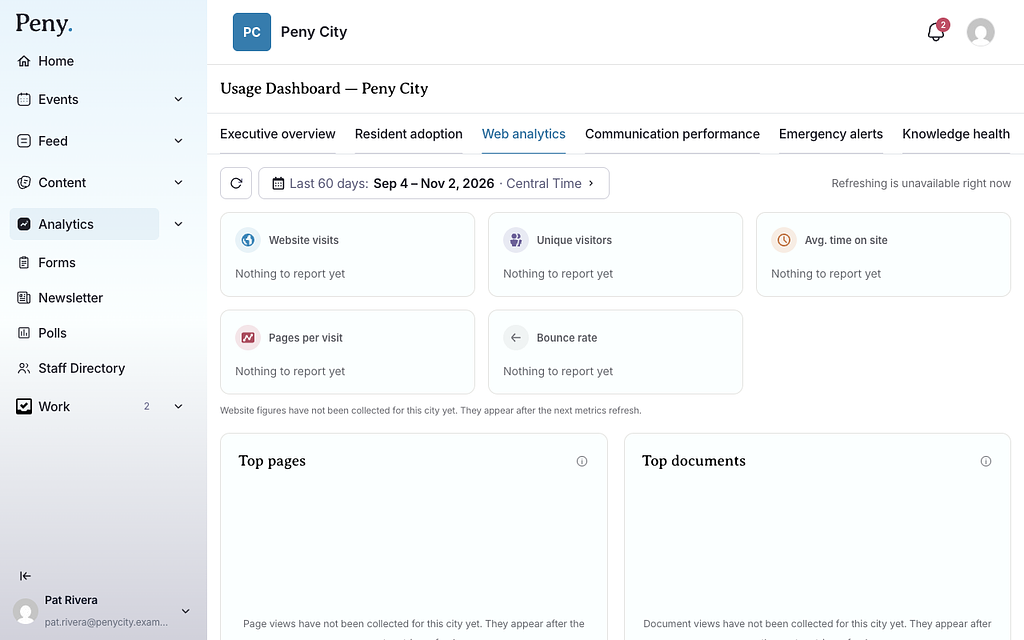
Your public website: Website visits, Unique visitors, Avg. time on site, Pages per visit and Bounce rate, plus your Top pages and Top documents. Use Filter by page on the chart to follow one page.
Website figures come from an analytics provider that only counts visitors who accepted cookies, so the real number of visitors is higher. Click the i button on a card for the details for your city.
Communication performance
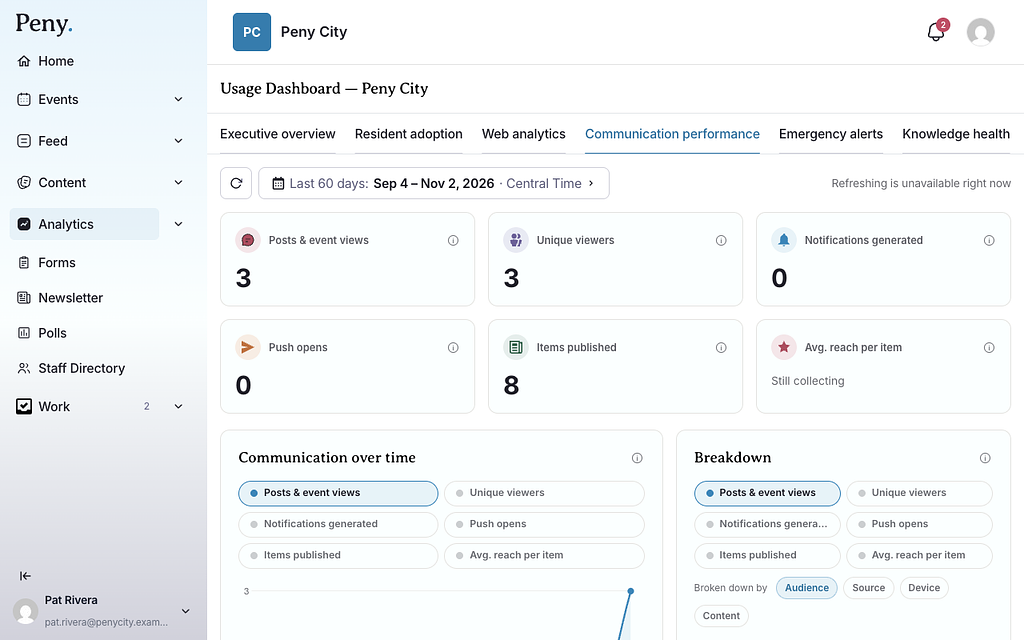
How far your posts and events reach: Posts & event views, Unique viewers, Notifications generated, Push opens, Items published and Avg. reach per item.
The Top posts & events table lists each item's Reach, Views and views From push. Search it, or filter by Content type or Topic.
Emergency alerts
How your emergency and critical alerts performed: Alerts sent, Views in first 7 days, Push click-through and Median time to open.
Select an alert in the Alerts sent list to see how it reached residents, including Residents notified and a map of Where this alert reached, showing households that Opened it and those that didn't.
Knowledge health
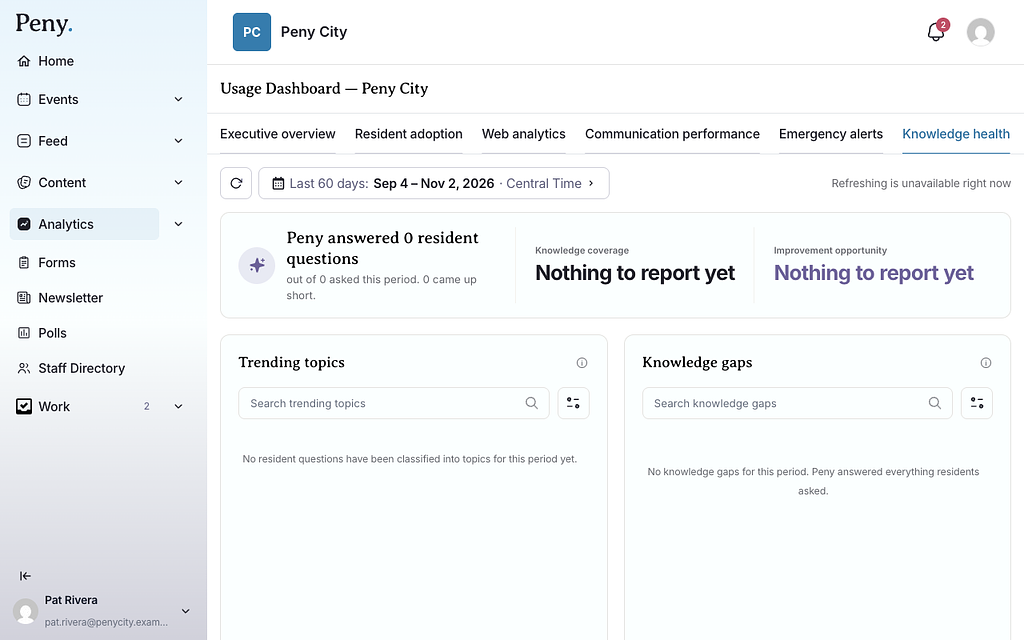
How well Peny's AI answers residents' questions. The headline reads like "Peny answered 120 resident questions out of 140 asked this period."
- Knowledge coverage: The share of residents' city questions Peny answered using your city's content. Off-topic questions and emergencies are left out.
- Improvement opportunity: The share Peny came up short on: your content doesn't cover it yet, the resident said the answer didn't help, or Peny couldn't finish the answer.
- Trending topics: What residents ask about most.
- Knowledge gaps: Topics where residents ask questions Peny can't fully answer. Start here to decide what to publish next.
- AI answers breakdown: Splits answers by Audience, Topic, Resident feedback and, for gaps, Review status.
The Knowledge gaps list counts every question Peny came up short on. Your Questions Inbox only holds the ones residents chose to share with the city, so its count is usually lower. When you mark a question's issue type in the inbox, the Knowledge health figures update to match.